Research Facilitation Project
Fellow: Kashika Mahajan
Mentors: Andrew Owen & Ian Ross
Fellowship Dates: May 19 - August 8 2025
Background
Researchers often have a hard time quickly figuring out how their computational workloads are doing. In the HTCondor system, researchers have the option to submit a group of multiple jobs, said to be a cluster of jobs. The way cluster data is currently shown through the system can be overwhelming and hard to interpret, especially for someone who isn’t deeply familiar with how everything works. It’s not always obvious whether their jobs are running smoothly, stuck, or underperforming.
That’s what this project set out to fix. We wanted to build tools that make it easier for researchers to understand what’s going on with their jobs, without having to dig through complicated logs or system outputs. A big part of the process was also figuring out what information researchers actually care about most, and how we could present that in a way that’s simple, useful, and clear.
Project Description
Project Scope
- Identify which metrics matter most to both researchers and the facilitation team when evaluating the health of a workload (e.g., a cluster of jobs)
- Define what “healthy” workload behavior looks like determined by few key parameters
- Develop tools that provide clear, easy-to-understand feedback on key job attributes, making it simpler and faster to assess performance
Project Challenges
- Designing for Non-Experts: Creating tools that are useful not just for facilitators or developers, but also for researchers who may not be familiar with HTCondor’s internal metrics or terminology.
- Balancing Detail vs Simplicity: Deciding how much information to show: too little and it’s not useful, too much and it becomes overwhelming. Finding that the balance for clarity and usefulness took iteration and user feedback in the form of a focus group.
- Getting the Data: Since attributes are encoded as classads for the jobs, it was important to make efficient use of the HTCondor Python bindings and historic job records stored in Elasticsearch to get the data we need for the specific tools.
Project Vision
The project vision entailed giving feedback in a way that researchers don’t have to guess about how their workload is doing. The idea evolved into having a flag system where researchers can just get a red flag if certain key metrics indicate poor health (workload having some sort of issue), a yellow flag (if the workload can perform better in certain aspects) and a green flag signalling no detected problems. The fellowship entailed creating the individual components dealing with a specific metric, which can be integrated into a cohesive flag system.
Project Deliverables
-
Cluster Status Dashboard
Purpose:
To provide a quick visual overview of a cluster’s job statuses in one place.Key Features:
- Accumulates data from both queue and history views
- Shows real-time status distribution of jobs (Idle, Running, Held, Completed, etc.)
- Helps researchers identify stuck or abnormal patterns without parsing long outputs
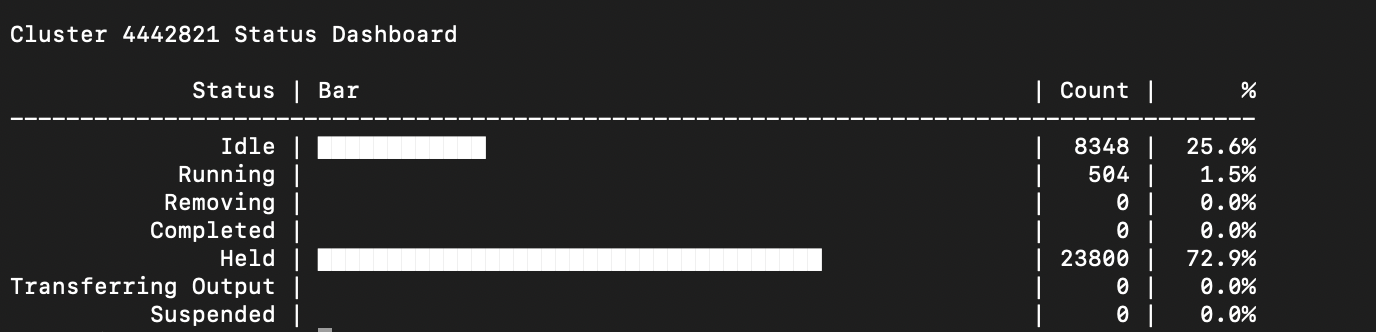
Fig (a) : Example output for Cluster dashboard
-
Cluster Runtime Histogram
Purpose:
To give insights into how long jobs in a cluster are running.Key Features:
- Runtimes are binned based on percentiles for meaningful distribution
- Highlights jobs with runtime < 10 minutes, which may indicate premature failures or setup issues
- Option to print Job IDs of short-running jobs for further inspection
- Helps users understand runtime variance across the cluster
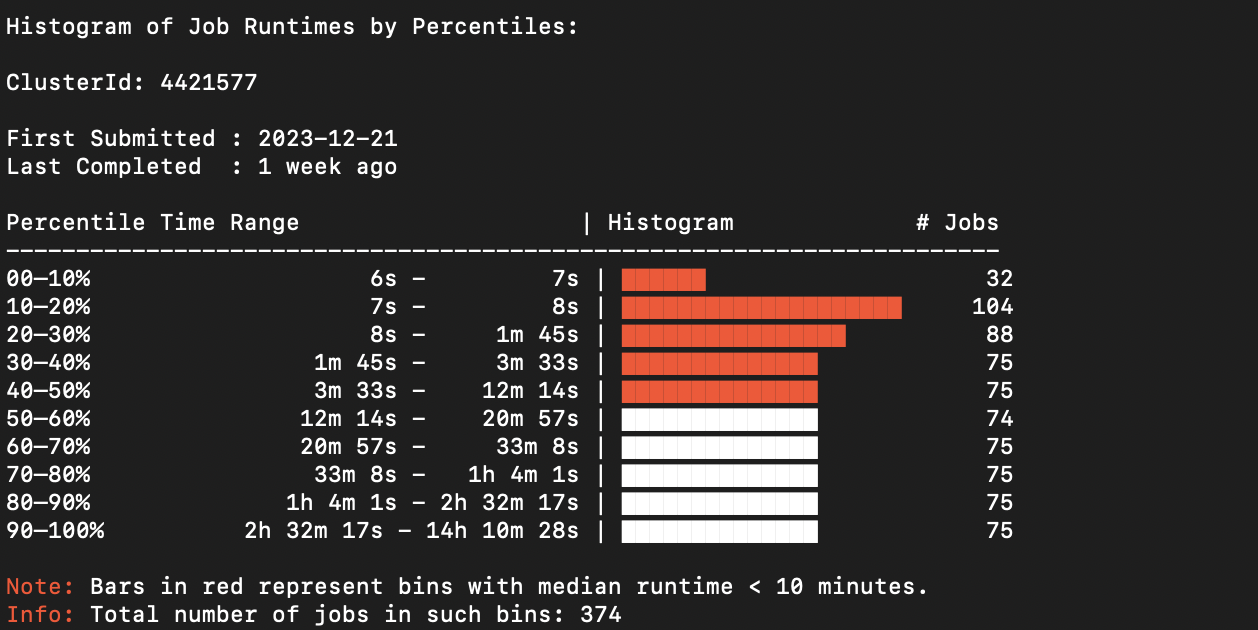
Fig (b) : Example output for Runtime Histogram
-
Hold Classifier
Purpose:
To simplify the process of diagnosing why jobs are being held.Key Features:
- Groups jobs based on HoldReasonCode, HoldReasonSubCode, and textual matching of HoldReason
- Provides a summary table with:
- Hold label
- Number of affected jobs
- Example error message
- Generates a legend explaining hold reasons in human-readable terms
- Adaptively pulls and updates from a mapping table of known hold reasons
- Greatly reduces the effort needed to understand job failures or misconfigurations
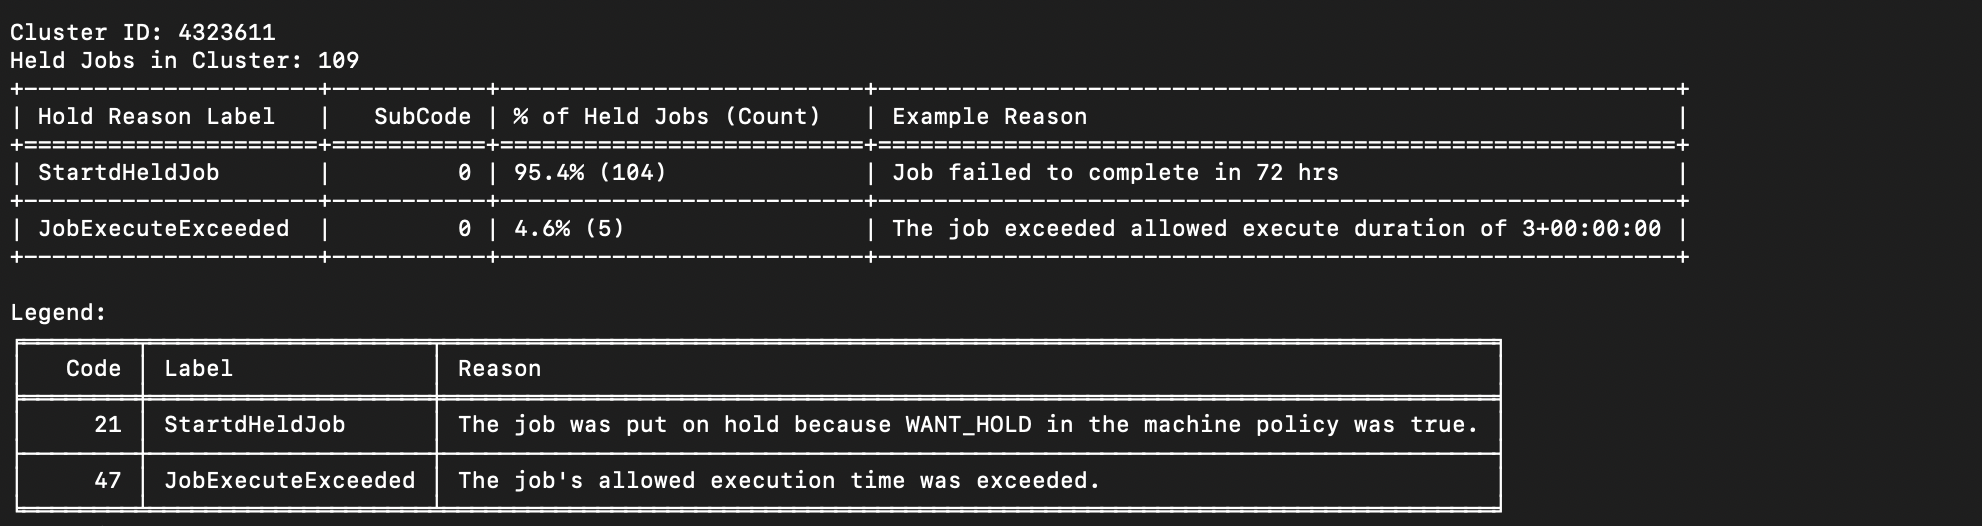
Fig (c) : Example output for Hold Classifier
-
Resource Utilization Report
Purpose:
To help users compare what resources were requested vs. what was actually used.Key Features:
- Table summarizing resource requests across the cluster (CPU, memory, disk)
- Table with statistical summaries (e.g. min, max, median, quartiles, standard deviation) of actual resource usage
- Visual bar chart to highlight utilization efficiency
- Flag system to call out underutilization (<15%) or overutilization (>80%) of resources
- Allows users to tune future job submissions for better resource matching
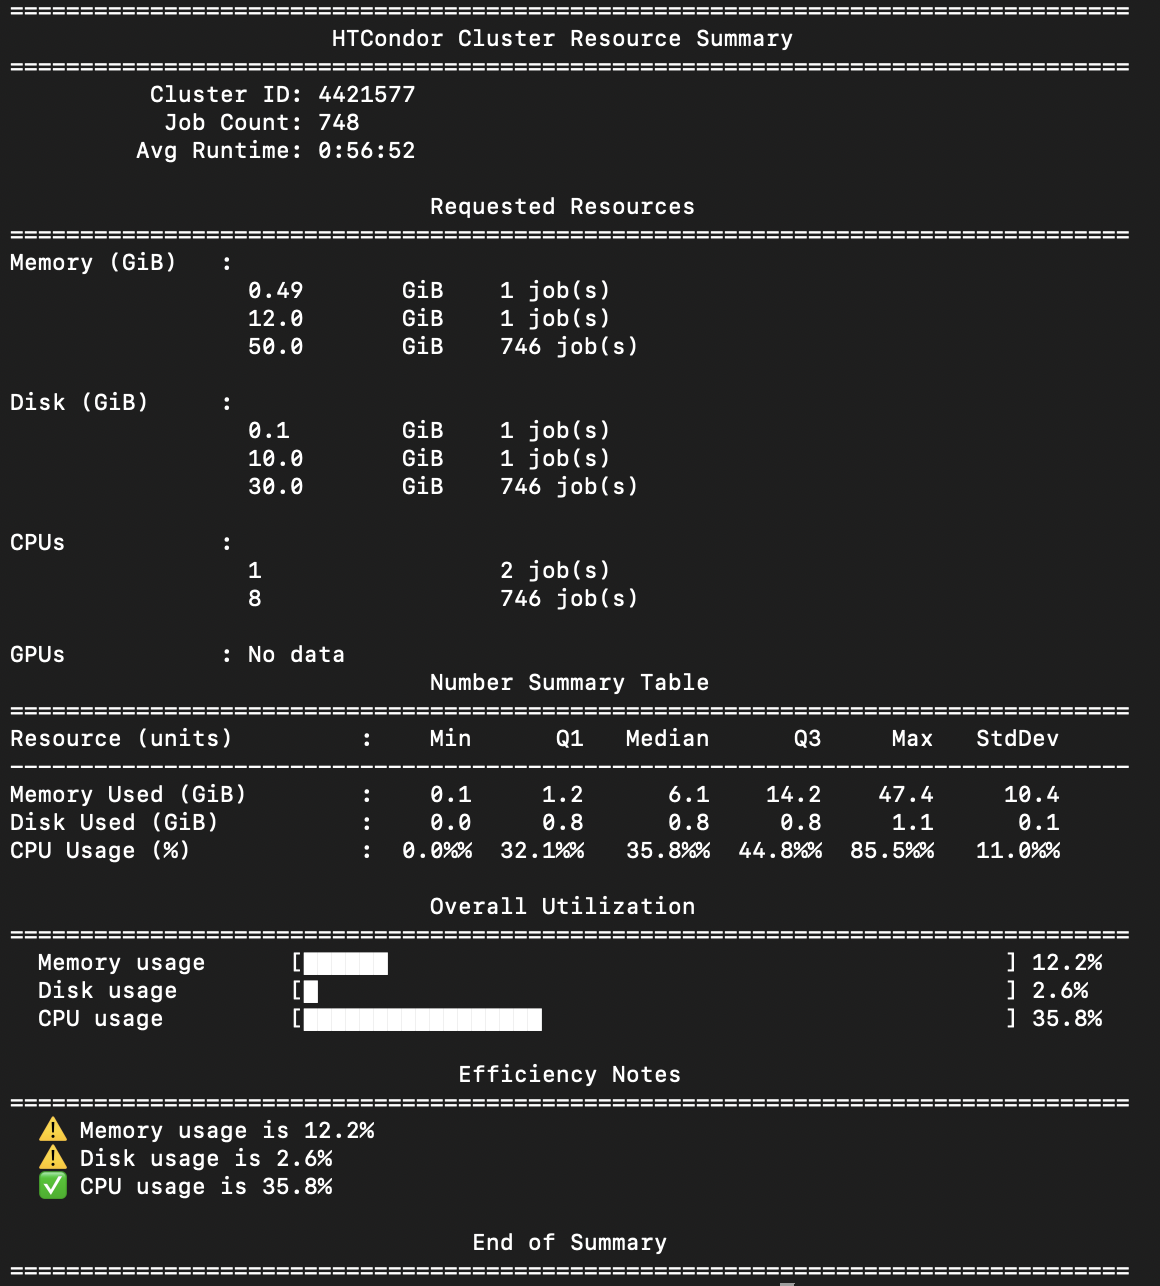
Fig (d) : Example Output for Resource Utilization Report
Project Outcome
By the end of the fellowship we were able to:
- Identify the metrics needed to be assessed for the evaluation tool
- Organise a focus group consisting of researchers who use HTCondor to gain insight into what is important for them to know and how can we better convey it
- Make 4 tools that researchers or the facilitation staff at the CHTC can use to get specific information about clusters, (Status, Runtime, Hold Jobs, Resource Utilization)
For the scope decided and the given time, it was a successful project which lays a foundation for more work to be done in understanding cluster behaviour and feedback system at the CHTC.
Shortcomings and Limitations
- These tools are not yet available for researchers to use through a condor command
- The tools get the data about the clusters from the Elasticsearch query which is not feasible for researchers as they do not have authentication to access the data.
- The tools have not been tested by actual researchers thus the full scale of their utility is not known
Recommendations for Next Phase of Project
For the next steps of the projects, the first essential step would be to make the pipeline to get the data for these tools coherent and consistent throughout. That would be achievable by either making changes to the Python bindings, or coming up with a way that stores information about jobs for the user in their access point.
The next step would be to look into how the file sizes of the jobs’ output can be used to find irregularities in a cluster. Similarly, more time and research will be fruitful in finding more parameters that be be used to be provide a definitive health status for a workload
Finally, making the cumulative evaluation tool with the flag system that is available to researchers through the Condor commands. This tool then should be subjected to testing by users for comprehensive feedback and possible advancements,
Lessons Learned
Lessons Learned
This fellowship taught me how to design deliverables with a specific user base in mind, and gave me valuable exposure to collaborative, structured research environments. I learned how to work with project management, communicate effectively, and incorporate feedback to improve my work. Two key takeaways were:
- Flexibility matters: Being open to feedback and iteration led to a much stronger final product.
- Facilitation is key: Bridging the gap between complex systems and researchers is essential for meaningful impact.
Technical Learnings
Through this project, I strengthened my Python skills and learned new techniques like querying Elasticsearch and creating ASCII-based data visualizations. Gaining hands-on experience with HTCondor was especially valuable, it helped me better understand the user perspective and navigate the complexities of a distributed system to build more effective tools.
Project Material Links and Descriptions
Github Page with all the code:
https://github.com/kashikamahajan/CHTC-Summer-Research-Facilitation-Project