Where In The World Am I?
Fellow: Neha Talluri
Mentor: Jason Patton
Timeline: Jun 3, 2024 - Aug 23, 2024
Background
The OSPool aims to improve the throughput of research workflows submitted to OSPool access points, which run in a distributed computing environment. Within the OSPool infrastructure, the GlideinWMS frontend serves as a broker, attempting to allocate computing resources to resource requests submitted by research jobs and workflows. The GlideinWMS frontend translates these resource requests into allocation requests, which are sent to the GlideinWMS Factory, which then interacts with the HTCondor-CEs that sit in front of each opportunistic computing site. The CE then submits glidein jobs to the site’s local batch system, which initiates glideins on idle worker nodes, transforming them into resources that the OSPool can utilize for the research workflows that have requested them. By leveraging the OSPool infrastructure, including the glideinWMS frontend, factory, HTCondor-CE, batch systems, and worker nodes, this process efficiently aligns workloads with appropriate computer resources, thereby minimizing wait times and enhancing research productivity through optimized use of opportunistic computational resources.
Project Description
This project aimed to answer the question “where in the world am I?” in the context of OSPool glideins, with a particular focus on addressing the question, “am I lost?” In this context, ‘lost’ doesn’t mean that a resource, machine, or glidein is missing from the OSPool. Instead, it refers to situations where the data suggests that a resource’s machine is an outlier, raising concerns about its identity or status. These outliers can then be investigated by OSPool and resource administrators to determine whether an outlier machine represents a new, unrecorded entity or a misrecorded entity in the OSG Topology, or if it is malfunctioning equipment.
Project Scope
The first phase focused on developing a new glidein script designed to generate data that captured the system and network characteristics of worker nodes where glideins are deployed. Alongside this, a collector script was created to gather attributes from machine ads, parsing and organizing the data into CSV files for detailed analysis. This collector script collected a wide range of information, including manual tags, network and geographic locations, and host fingerprinting details. These efforts resulted in the creation of a comprehensive dataset, which was crucial for providing in-depth insights across the OSPool and glideinWMS systems.
The second phase of the project was centered on visualization and reporting, which led to the development of a statistics script focused on identifying outliers in the collected data. To support the identification process, various visualizations and statistical measures were created. The primary goal of this phase was to detect outliers effectively, while the accompanying visualizations and statistical data helped to deepen the understanding of these outliers. This approach enabled the identification of outliers, allowing for immediate and informed responses to potential issues in network performance and resource documentation.
Project Challenge
The initial challenge was to understand glideins, glideinWMS, and the OSPool itself. I began by submitting jobs to the OSPool and examining glidein logs to learn how glideins gather information and to learn what software was available on worker nodes. Understanding the lifecycle of a glidein was crucial, as it provided insight into how data about glideins flows within the OSPool system. This foundational knowledge was essential for developing scripts that could effectively gather and advertise data.
Another significant challenge involved defining and answering questions about location within a networking space. Ultimately, this required determining the network distance between caches and resources, where distance was measured in terms of network latency, rather than traditional geographical metrics. The concept of location was redefined as the relationship between a resource and a cache, which required shifting from conventional geographical mapping to a more nuanced understanding of network topology and performance metrics.
Project Vision
The original vision of the project was to develop a reliable method for accurately identifying the locations of glideins within a network. This vision seeked to answer the overarching question “where in the world Am I?”, which we have started by first addressing the question, “am I lost?” This involves identifying issues with machines or resources that, while not missing, differ from known resource information, suggesting that their identities may be unknown or questionable. Additionally, the project aims to enhance glidein transparency by creating tools and processes that improve visibility into the pool. This increased transparency will enable more efficient monitoring and maintenance of the OSPool’s information and system quality, providing the necessary insights and data to contact institutions and resolve issues when machines or resources are misrecorded, unrecorded, or malfunctioning.
Project Deliverables
Data Generation
The where-am-i glidein script is triggered when new glideins are created, and reports to glidein logs and machine ads by collecting and advertising system data such as IP addresses, hostname information, and network interfaces. It also advertises network diagnostics through checks using traceroute and TCPing (an alternative to the traditional ping utility that uses TCP packets targeted at a port instead of ICMP packets). The script dynamically updates the configuration by employing conditional checks and external utilities to gather data, adapting its behavior based on the success of these operations and logging the results accordingly.
Data Collection
The collector.py script was designed to gather data from machine ads advertised by glideins that utilize the Where-am-I script. It parses and organizes this data into Pandas DataFrames, which are then stored in CSV files within a local designated directory. To ensure efficiency, the script only adds new entries based on unique identifiers, maintaining a log (collector_ids.csv) of processed glidein IDs to prevent redundant data collection.
The data collected by the script encompasses several categories. Manual tags include cache name, institution, site, resource, and glidein IDs. Network location data is captured through IP addresses (both IPv4 and IPv6), routes and hops using traceroute, MAC addresses, and latency measurements via TCPing. Additionally, IP geolocation data is gathered, including latitude, longitude, and accuracy using the MaxMind geoIP database. Host fingerprinting data collected includes hostname(s), container or VM information, operating system details, batch system and central manager, number of networks, kernel version, and CPU, memory, and GPU information.
Data Interpretation
The stats.py statistics script focuses on identifying outlier machines within a resource based on z-scores, generating a report on these outliers that suggest further investigation. Outliers are identified by calculating z-scores from the average latencies of ping data from each resource and associated machines to the OSDF Kansas cache, with any z-score whose absolute value is greater than two flagged as an outlier.
To aid in the investigation of these outliers, the script also produces various visualizations, including stem, histogram, and scatter plots, that visually represent the latency data associated with different resources and associated MAC addresses (machines). Additionally, it calculates key statistical measures such as mean, median, and standard deviation per resource to provide a more comprehensive understanding of the data and help contextualize the outliers identified.
“Am I Lost?” Pipeline

The pipeline illustrates the workflow involving the submission and execution of “crondor jobs” (condor jobs which run scheduled tasks), collection of data, and analysis of data to find outliers within a resource. The arrows in the diagram indicate the direction of actions and dependencies between different components of the workflow.
Final Statistics Data Deliverables (UMT-Hellgate-ce1 example)
Outliers
| Resource Name | Mac Address | Date | Time | Latency | Z_Score |
|---|---|---|---|---|---|
| umt-hellgate-ce1 | a0:36:9f:40:0a:48 | 2024-08-21 | 20:30 | 49.346 | 3.21 |
| umt-hellgate-ce1 | a0:36:9f:40:0a:48 | 2024-08-21 | 21:00 | 49.344 | 3.21 |
| umt-hellgate-ce1 | a0:36:9f:40:0a:48 | 2024-08-21 | 23:30 | 49.375 | 3.21 |
| … | |||||
| umt-hellgate-ce1 | d8:5e:d3:4c:74:7b | 2024-08-17 | 06:00 | 52.159 | 3.82 |
| umt-hellgate-ce1 | d8:5e:d3:4c:74:7b | 2024-08-17 | 09:00 | 62.954 | 6.14 |
| umt-hellgate-ce1 | d8:5e:d3:4c:74:7b | 2024-08-18 | 12:00 | 44.206 | 2.11 |
Statistics
| Resource Name | Mean | Median | Variance | Standard Deviation | 25th Percentile | 75th Percentile | Latencies |
|---|---|---|---|---|---|---|---|
| umt-hellgate-ce1 | 34.43 | 32.588 | 21.56 | 4.643772749955741 | 32.53 | 33.782 | [list of all latencies used to get statistics] |
Stem Plot

Scatter Plot
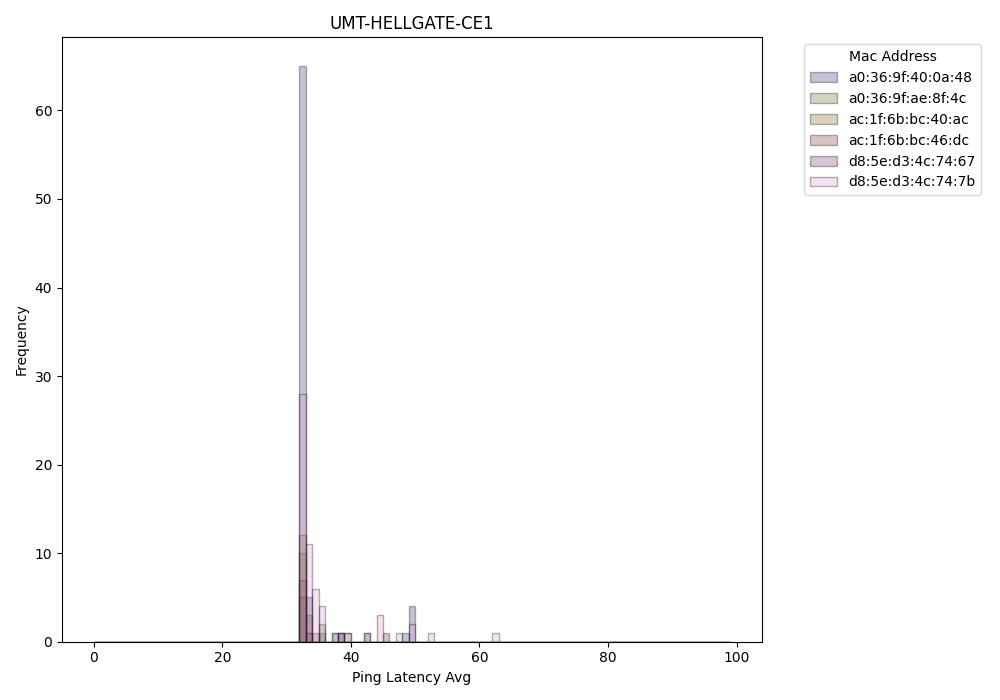
Histogram

Project Outcome
In the end, I developed a pipeline to identify outlier machines within a resource, which is one potential method of answering the question, “Am I lost?”. This also addressed the broader question, “Where in the world am I?” by pinpointing and investigating outliers within the distributed system, ultimately ensuring better maintenance of information and system quality within the OSPool.
Lessons Learned
I learned that exploration for a project takes significantly more time and effort than I initially anticipated. This realization taught me the importance of patience, thorough planning, and the ability to adapt when things don’t go as expected. Additionally, I learned to appreciate null results as an important aspect of research, recognizing that they provide valuable insights and guide the direction of future experiments.
Dealing with sudden changes in a project was another key lesson, helping me become more flexible and resilient in the face of unexpected shifts in goals or priorities. I also gained experience in navigating the diverse personalities within a team, understanding the importance of effective communication and collaboration to maintain team cohesion and productivity.
I also deepened my understanding of distributed computing, learning how this side of research plays a vital role in advancing other fields. Distributed computing provides the necessary compute power and memory resources that enable researchers to process large datasets and perform complex calculations more efficiently, ultimately accelerating the pace of scientific discovery. This experience showed me the interconnectedness of research disciplines and the importance of building computational infrastructures to support a wide range of scientific goals.
Project Material Links and Descriptions
Pipeline and code for generating data, collecting data, and running statistics: https://github.com/ntalluri/where-am-i
Glidein “where-am-i” wrapper script: https://github.com/opensciencegrid/osg-flock/blob/master/ospool-pilot/itb/pilot/where-am-i